Light is fundamental to plant growth, and for growers, understanding and optimising lighting isn’t just a matter of mastering plant science—it’s a critical business decision that directly impacts yield, quality, and profitability. The methods for defining and measuring light in horticulture applications are continuously evolving, which can sometimes lead to confusion. To help clarify, we’ve created the breakdown below, outlining key lighting terminology in controlled environment agriculture (CEA).
Photon
A photon is a massless, charge-free particle of light that functions as a discrete packet of energy, or quantum. Its energy determines the type of electromagnetic radiation it carries, ranging from low-energy radio waves to high-energy gamma rays.
Wavebands & Wavelengths
A waveband is a continuous segment of the electromagnetic spectrum, encompassing a range of wavelengths, for example Blue Waveband (400-500 nm) or Red Waveband (600 – 700nm). A wavelength is the distance between consecutive peaks (crests) of a light wave, typically measured in nanometres (nm).
Spectrum
A spectrum represents the distribution of energy emitted by a radiation source across various wavelengths, showing how intensity changes along the electromagnetic spectrum. In horticultural lighting, spectrums are generally classified into three main types:
Monochromatic Spectrum: This type focuses energy within a single wavelength or narrow waveband, such as red light. Monochromatic spectrums are particularly useful in applications requiring precise wavelength targeting, such as plant physiological studies or triggering specific developmental responses.
Dual Spectrum: Featuring two primary wavebands, typically red and blue, dual spectrums were a defining feature of early LED lighting in greenhouse applications. While they efficiently target photosynthetically active regions, they can create harsh working environments for humans and often result in undesirable plant morphology. Consequently, their usage has significantly declined in favour of broader spectrums.
Broad, Full, or Wide Spectrum: Encompassing a continuous range of wavebands, broad spectrums typically include blue, green, and red light, with optional extensions into ultraviolet (UV) and far-red (FR) regions. Broad spectrums are highly recommended for both supplemental and sole-source lighting, as they can more effectively support balanced plant growth and development.
Although broad spectrums are now the preferred choice for most horticultural applications, monochromatic and dual spectrums continue to play important roles in research and experimental contexts, where precise manipulation of light quality is essential.
Photosynthetically Active Radiation (PAR)
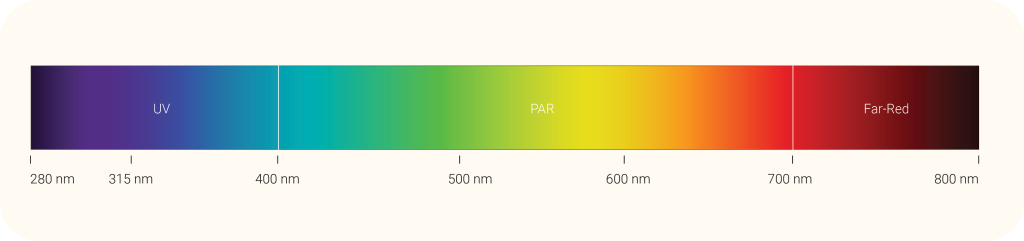
PAR represents the portion of the light spectrum (400–700 nm) that plants use for photosynthesis.
- 400–500 nm: Blue waveband
- 500–600 nm: Green waveband
- 600–700 nm: Red waveband
Extended Photosynthetically Active Radiation (EPAR)
EPAR extends beyond the PAR spectrum to include additional Far-Red wavelengths between 700–750 nm based on the Emerson enhancement effect and the R:FR ratio.
Biological Photosynthetically Active Radiation (BPAR)
BPAR, like EPAR, extends beyond the traditional PAR range (400–700 nm) to include additional wavebands, such as ultraviolet (UV) and far-red (FR). The exact definition of BPAR can vary between manufacturers, making it crucial to verify the specific wavelength range used when evaluating lighting solutions for your application.
- 280–315 nm: Ultraviolet B (UVB)
- 315–380 nm: Ultraviolet A (UVA)
- 700–800 nm: Far-Red (FR)
To simplify these definitions, PAR (400–700 nm) primarily provides plants with energy for photosynthesis, while wavelengths outside of PAR, including those in the EPAR and BPAR ranges, convey environmental information that influences plant adaptation, such as triggering the shade avoidance syndrome (SAS). It is important to consider that light intensity can also elicit similar physiological responses in plants.
Photosynthetic Photon Flux (PPF)
PPF measures the total number of photons emitted by a light source within the PAR spectrum (400–700 nm) per second, expressed in micromoles per second (µmol/s). For example, a 1 kW LED toplight with a PPF output of 3000 µmol/s indicates the total PAR light emitted by the fixture. However, PPF does not account for the losses in PAR light as it travels from the fixture to the plant canopy.
These losses can result from factors including but not limited to the toplight’s optical design, LED degradation over time, fixture cleanliness, mounting clearance, electrical supply stability, and the reflectivity of the surrounding environment.
Photosynthetic Photon Flux Density (PPFD)
PPFD quantifies the number of photons reaching a specific surface area, such as a plant canopy, for photosynthesis. It is measured in micromoles per square meter per second (µmol/m²/s) within the PAR spectrum (400–700 nm).
Unlike PPF, which measures the total light emitted by a fixture, PPFD represents the usable PAR light that actually reaches the plant canopy, accounting for losses such as fixture inefficiencies and environmental factors. Additionally, PPFD includes contributions from spill light or supplemental sources like solar radiation.

Photosynthetic Photon Efficacy (PPE)
Photosynthetic Photon Efficacy (PPE) measures the efficiency with which a light source converts electrical energy into photosynthetically active radiation (PAR), expressed in micromoles per joule (µmol/J). For reference, 1 joule per second is equivalent to 1 watt. PPE can be calculated using the following formula:

Photon Flux (PF) & Photon Efficacy (PE)
Photon Flux (PF) and Photon Efficacy (PE) are similar to PPF and PPE but extend beyond the PAR range (400–700 nm) to include wavelengths outside this spectrum. The specific nanometre range used should be clarified by the lighting manufacturer when reporting PF and PE values. These metrics quantify the total photon flux and the efficiency of converting electrical energy into radiation across a wider electromagnetic range, including ultraviolet (UV), visible, and far-red wavelengths.
Photoperiod
Photoperiod refers to the duration of light exposure a plant receives within a 24-hour cycle. Also known as light duration or day length, it plays a vital role in plant development and is integral to calculating the Daily Light Integral (DLI).
The length of the photoperiod influences key processes such as flowering, dormancy, and vegetative growth. Depending on their photoperiodic response, plants are classified into three categories: Short-Day Plants (SDP), which require longer periods of darkness to flower; Long-Day Plants (LDP), which flower in response to longer periods of light; and Day-Neutral Plants (DNP), which are not affected by light duration and instead rely on other environmental factors for development.
Daily Light Integral (DLI)
The Daily Light Integral (DLI) represents the total quantity of photosynthetically active radiation (PAR) incident on a square meter over a 24-hour period, expressed in moles of light per square meter per day (mol m² d⁻¹). DLI quantifies the cumulative photon exposure available for photosynthesis and can be calculated using the following formula:

Solar Radiation
Solar radiation is shortwave energy emitted by the sun, covering wavelengths between 280 and 3000 nm. It includes visible light, ultraviolet (UV), and near-infrared radiation, typically measured in watts per square meter (W/m²).
PPFD Setpoint
A PPFD setpoint is the target light intensity, measured in micromoles per square meter per second (µmol/m²/s), that is defined by the grower and maintained within the controlled environment to optimise photosynthetic activity and support healthy plant growth.
Intensity Uniformity
Intensity uniformity measures how evenly PAR is distributed over the growing area, typically at the plant canopy. It is expressed as the percentage of the area that falls within a specified tolerance (e.g. 10%) of the PPFD setpoint.
Spectral Uniformity
Spectral uniformity assesses the consistency of the desired light spectrum across the growing area. It is quantified by the variation in the proportion of each waveband within the light recipe, measured at multiple intervals across the plant canopy.